Data Quality for Machine Learning
Introduction to Machine Learning
Machine learning is a type of artificial intelligence (AI) that involves training computer programs to learn and improve from experience, without being explicitly programmed to do so. In other words, machine learning algorithms can automatically learn and adapt from data, making predictions, and identifying patterns and relationships in the data. This allows them to perform tasks such as image recognition, speech recognition, natural language processing, and many others. Machine learning is becoming increasingly important in many fields, including healthcare, finance, transportation, and entertainment. It has the potential to transform the way we live and work, by enabling computers to make more accurate predictions and decisions based on data. AI also becomes more present in our all day lives, for example in form of ChatGPT that also wrote this paragraph.
Introduction to AIS
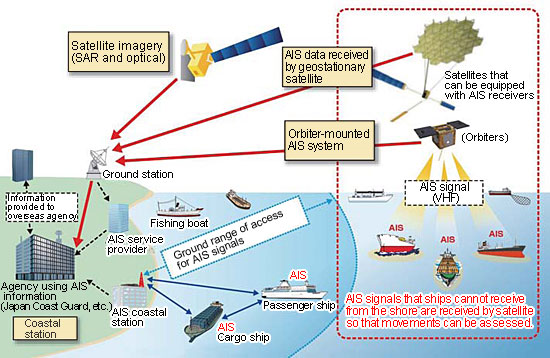
The Automatic Identification System (AIS) uses transeivers on ships to autmatically track vessels and provide identification and positioning information to both vessels and shore stations. AIS is used for collision avoidance, search and rescue, and maritime security. AIS is also used to provide information to the public about vessel traffic.
There are six different message types that can be transmitted by AIS. We will focus on the A and B classes that are for navigational safety and collision avoidance. Class A messages are sent at a higher frequency and contain more information than Class B messages, making them mandatory for larger vessels. These messages include the vessel's identity, position, course, speed, and other important data. Class B messages are optional for smaller vessels and transmit at a lower frequency, with less information. However, they still provide valuable information about the vessel's position, speed, and course, allowing for improved situational awareness and navigation safety. The Maritime Mobile Service Identity (MMSI) comes up in both classes and is used to identify a vessel. Both Class A and Class B messages are received and displayed by other vessels and shore-based stations equipped with AIS receivers, allowing for real-time tracking and monitoring of vessel movements. This information can be used to avoid collisions, navigate safely through congested waterways, and improve the efficiency of maritime traffic management.
Data Quality for Machine Learning
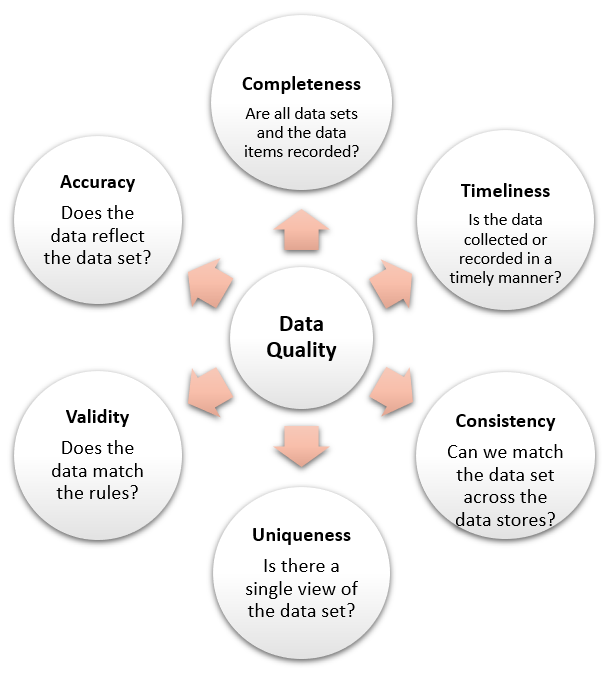
Often raw data cannot be directly used for machine learning. It needs to be cleaned and preprocessed. This is because machine learning algorithms are sensitive to missing values, outliers (an outlier is a datapoint that was e.g. generated from erreneous sensors), and other data quality issues. For example, if a dataset contains missing values, the algorithm will not be able to learn from those observations. Similarly, if a dataset contains outliers, the algorithm will be biased towards those observations. Therefore, it is important to clean and preprocess the data before using it for machine learning.
Data used for this Article
The website MarineCadastre.gov provides AIS data for the U.S. coast since 2009. Datasets contain either all collected datapoints of one day as a CSV file or all collected datapoints of one year condensed to tracks as a gpkg file. The data is provided by the Office for Coastal Management. In this article, we will use the points of the day 01/01/2021.
Studies have shown that the quality of the raw AIS data is not sufficient and needs to be cleaned and preprocessed before it can be used for machine learning. For example, the data contains many outliers and missing values. Also, for some fields, especially the ones that need human input, are often ambiguous or misleading.
Data Cleaning and Preprocessing
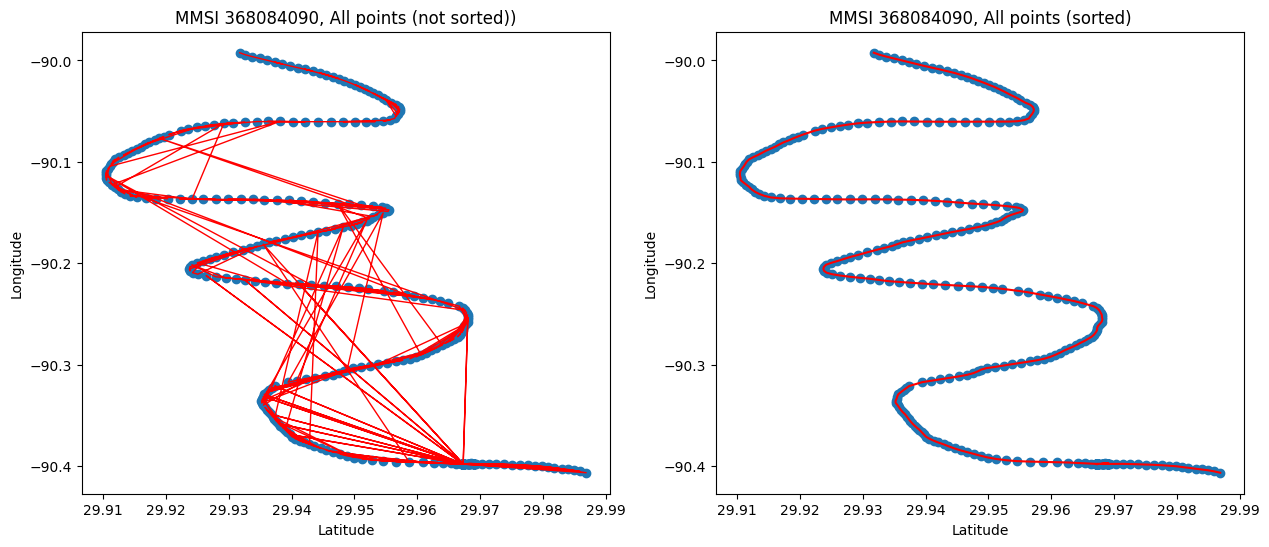
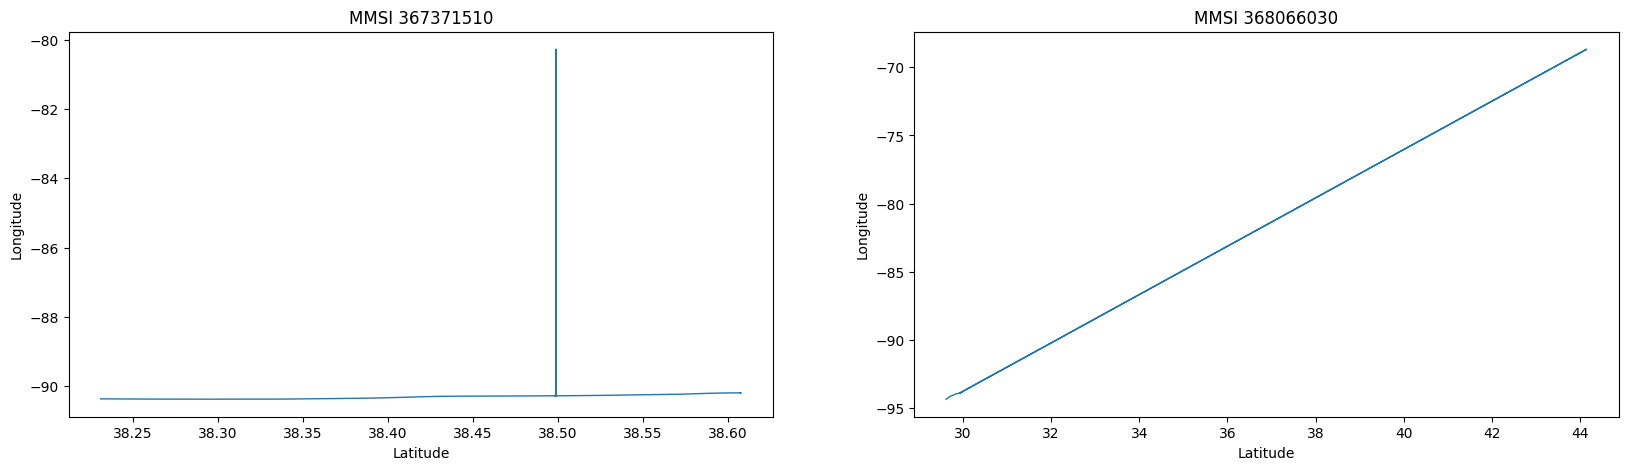
The first thing we can notice when plotting and connecting the points is that ordering them by time already increases the accuracy:
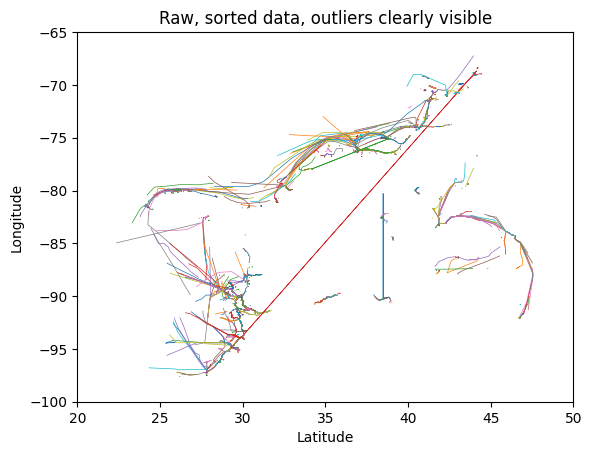
But as we can see in the following plot of all tracks in a small area, there are still many outliers that need to be removed because they would otherwise bias the machine learning algorithm:
To remove otliers, we split each track into subtracks. A subtrack is a sequence of points that are close to each other. We then remove all subtracks that are shorter than a certain threshold. Let us take a look at the following tracks from the above plot:
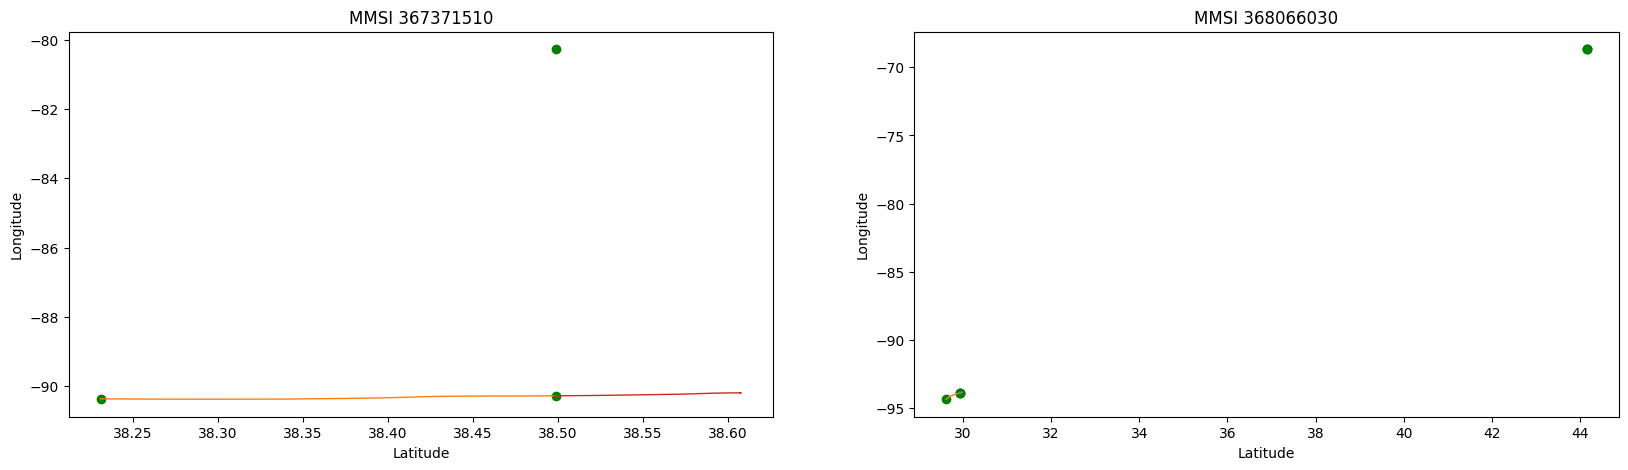
Segmentation of the tracks into subtracks and marking the beginning and end of each subtrack with a green dot gives us this:
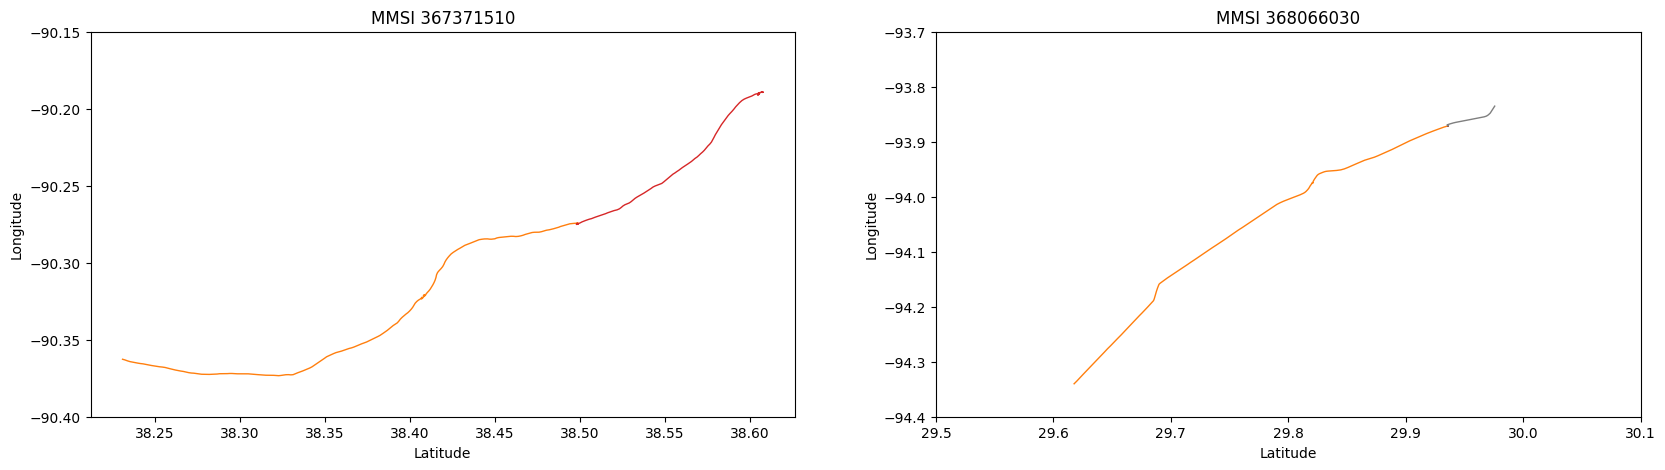
If we now remove all subtracks that are shorter than a certain threshold, we get the following result, where each track is now a sequence of subtracks that are close to each other, so that they just need to be connected to get the final track.
Data Quality Overview
In the following interactive visualization, we explore the data per vessel group. In the heatmap the we get a binned representation of the number of subtracks per vessel group. The number of subtracks is an indicator for the data quality in this case, because more subtracks mean that there possibly are more outliers where the original track is split.
In the first bar chart, we can see the number of vessels per group so we can compare the numbers of tracks to the group size. Since they are not distributed equally, a logarithmic scale is used. The number of vessels per group is for example important when looking at the second bar chart, where we can see the total number of subtracks per vessel group. We can notice that "Tug" has only few subtracks but in comparison with the number of vessels in this group, it is more similar to other groups. The last bar chart shows the average number of subtracks per vessel group.
A short usage guide for the interactive visualization: The heatmap has a brush tool that allows to select a subset of the data. The bar charts are then updated to show the data of the selected subset. To reset the selection, double click on the heatmap. If you click on a vessel group in the legend of the bar charts, the corresponding data is highlighted in all charts. To reset the selection, click below the legend.
Sources
- Automatic identification system - Wikipedia
- AIS (Automatic Identification System) overview - NATO
- Automatic Identification System (AIS): Data Reliability and Human Error Implications, Harati-Mokhtari et al.
- Ship Trajectories Pre-processing Based on AIS Data, Zhao et al.
- Point Data - Office for Coastal Management, 2023: Nationwide Automatic Identification System 2021, Download
- Project with CSV file containing a mapping from vessel type to vessel group
Code
The code for this article can be found in the GitHub repository. When using the code, make sure you have the required data files ("AIS_2022_01_01.csv" and "AIS_categories.csv") in the same directory as the notebook.